
Fundadores e Inversores
En la era de hoy, con abundancia de datos, los líderes tienen muchas métricas para elegir para comparar el progreso con sus iniciativas estratégicas. Sin embargo, incluso con todos estos datos, demasiado sintéticos, se enfocan en datos agregados, pasando por alto las métricas que más importan.
Cuando se sintetizan datos a un alto nivel, se corre el riesgo de crear métricas que podríamos llamar «sandías«: números que son verdes a simple vista, pero debajo de la superficie son rojos. Las sandías ocultan los problemas de ejecución subyacentes que ocurren en su equipo de ventas, y si se dejan plantados mucho tiempo, pueden arruinar el negocio de dentro hacia afuera.
Los líderes que se basan en promedios y agregados están perjudicando a su negocio al no profundizar lo suficiente para comprender el estado de sus objetivos comerciales y las áreas de mejora.
Por ejemplo, en un presentación de beneficios, Cloudflare reveló que habían “identificado a más de 100 personas en el equipo de ventas que constantemente no cumplieron con las expectativas. En pocas palabras, un porcentaje significativo de la fuerza de ventas ha tenido un rendimiento inferior en repetidas ocasiones en función de los objetivos de rendimiento medibles y los KPI críticos”.
¿Cómo 100 personas no cumplieron el objetivo durante tanto tiempo? Los líderes no estaban profundizando lo suficiente en los datos. Es importante identificar la causa raíz de los errores de estos vendedores y solucionarlo desde cero.
Esto es lo que significa buscar sandías, cómo identificarlas y el marco que proporciona mejores conocimientos y acciones para mejorar sus resultados.
Encontrar las sandías mediante análisis centrado en las personas
Al observar métricas de rendimiento importantes, muchos líderes tienen una visión demasiado limitada de sus datos. Las métricas de actividad y resultados suelen dividirse en varias dimensiones, como la industria, el segmento, la geografía, la línea de productos, el grupo de clientes y el perfil de compra, para que los líderes puedan responder preguntas como «¿Cuál es la tasa de beneficios para la fabricación en el mercado medio en ¿Europa?» Esto es genial, pero casi todas las empresas pasan por alto una de las dimensiones más importantes: las personas.
No mirar las métricas de las personas oscurece el rendimiento inconsistente en todo el equipo, lo que mata la productividad general. Digamos que su tasa de beneficios promedio es del 34%: lo que puede parecer una métrica maravillosamente saludable podría ser una sandía completa. Francamente, para la mayoría de las empresas, lo que probablemente sucede es que la tasa de ganancias del cuartil de mayor rendimiento está por encima del punto máximo, mientras que la tasa de beneficios de la mayoría del equipo es baja.
No se descubre esta realidad a menos que se mire la dimensión de las personas, examinando la distribución del desempeño de cada persona contra la métrica. Esto puede parecerse a:
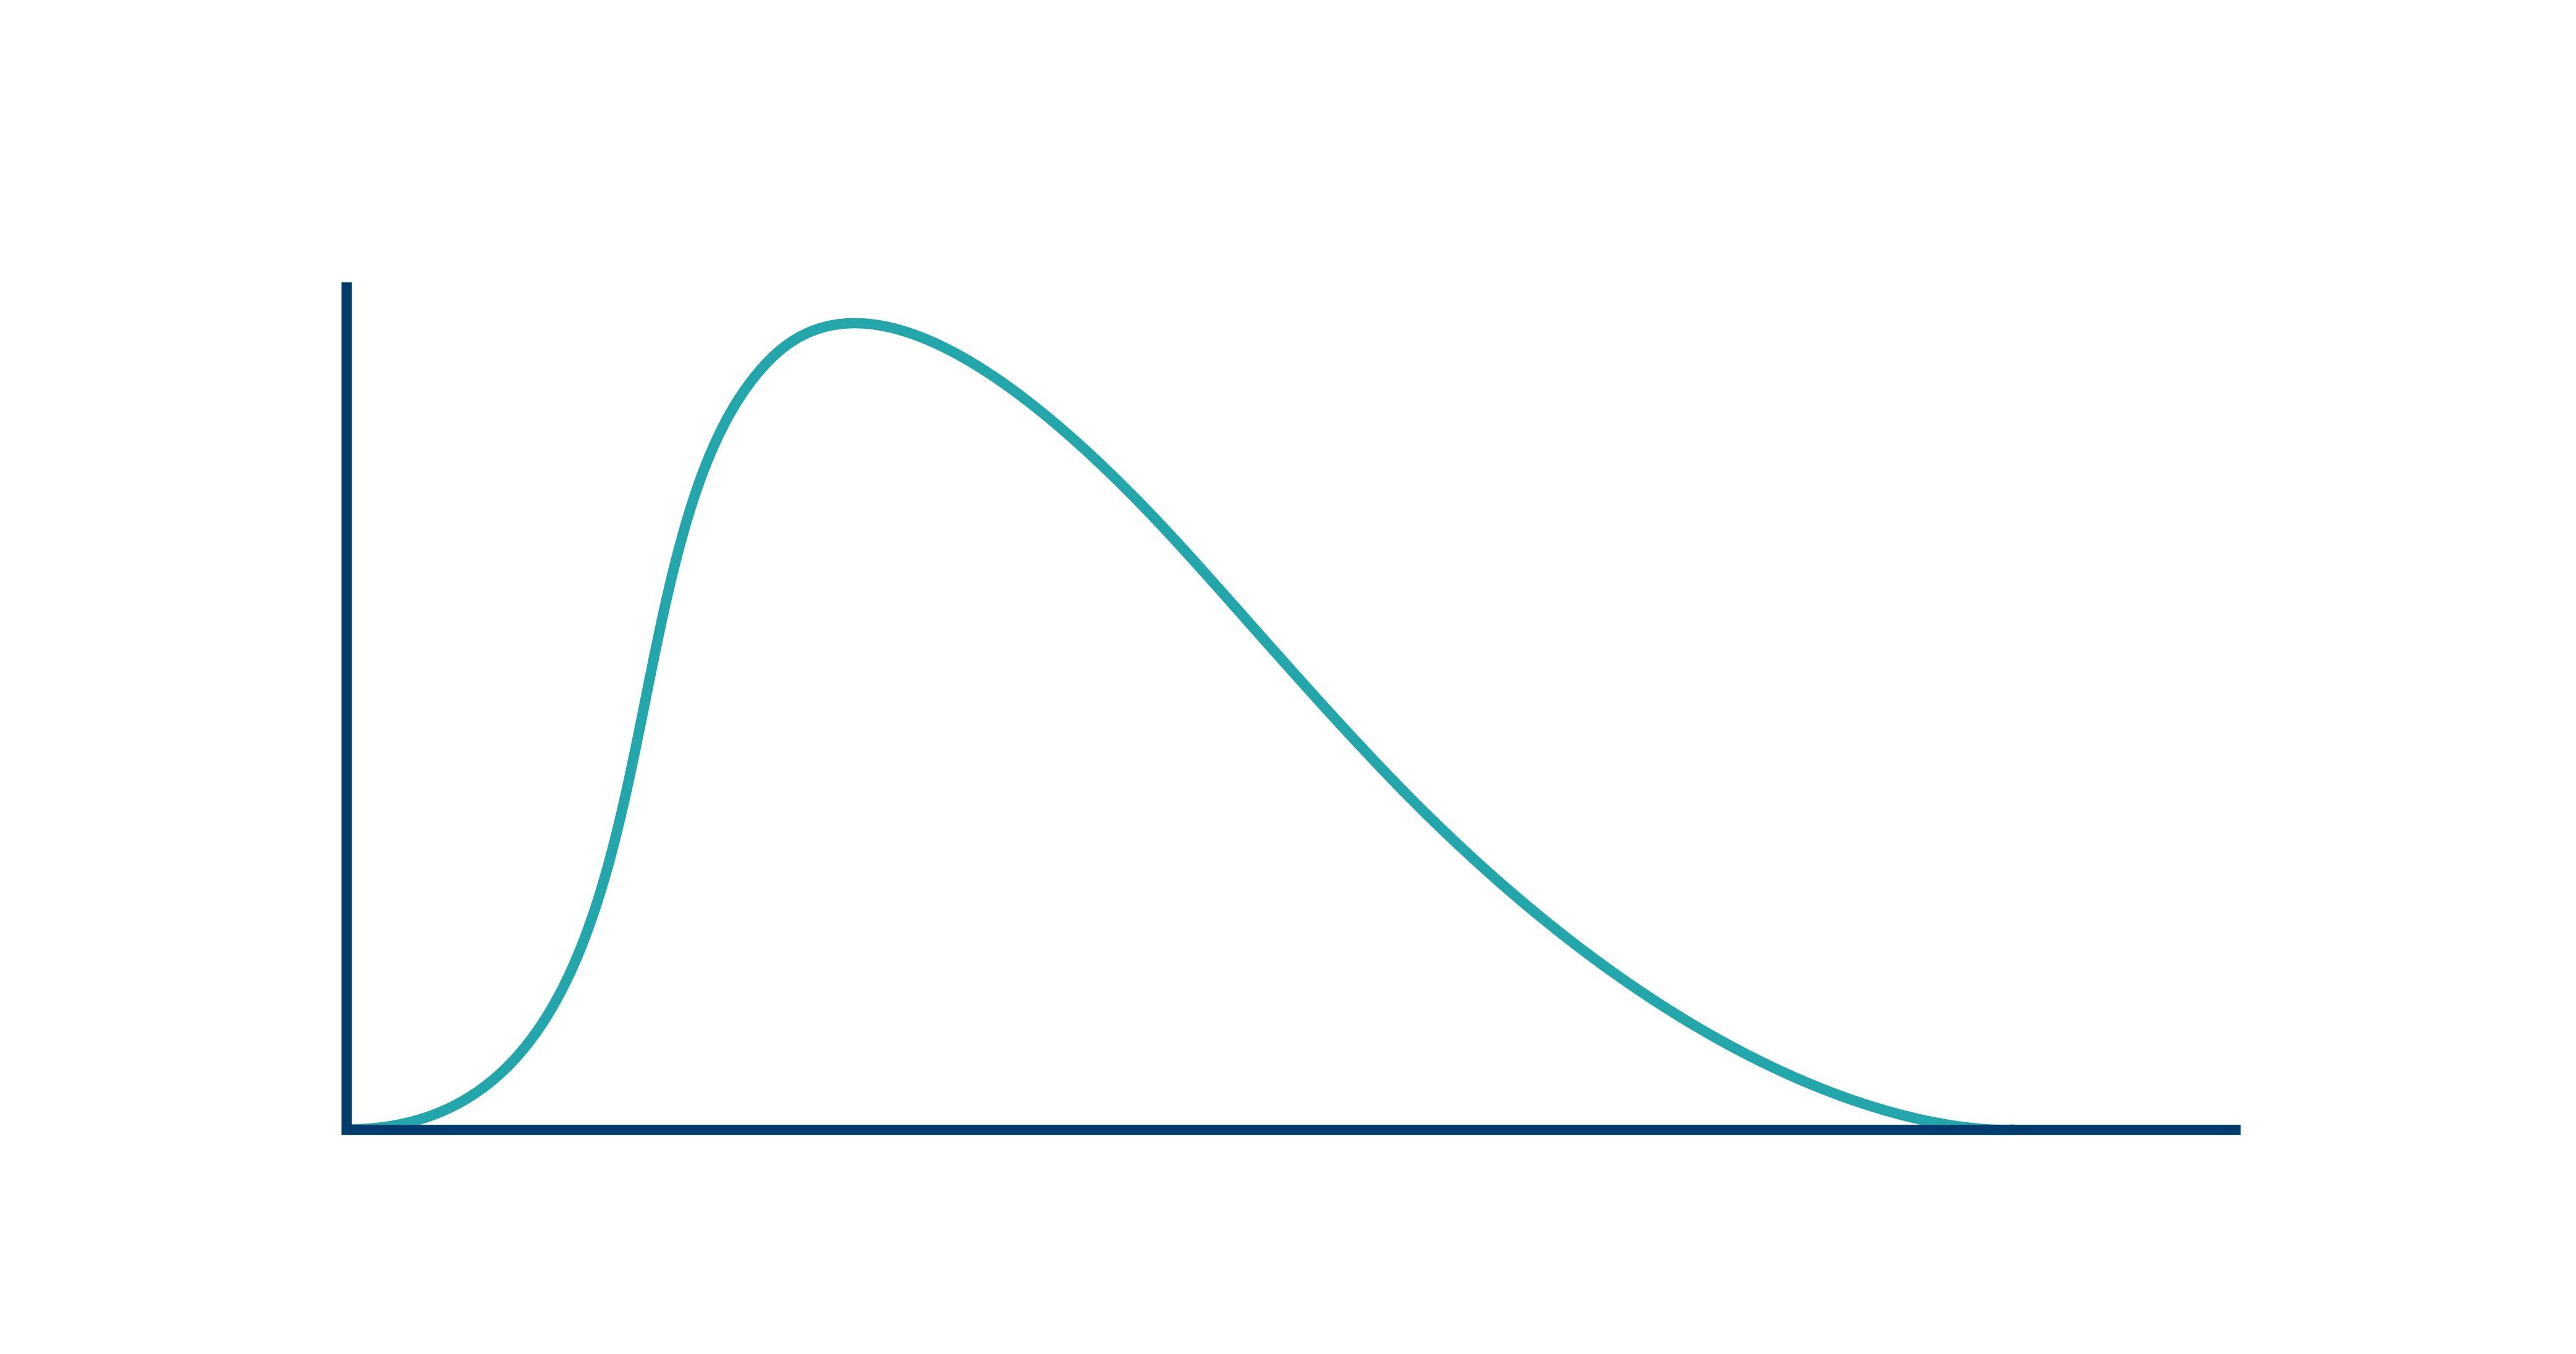
Distribución del desempeño de la persona en comparación con su promedio de beneficios.
Analizar las distribuciones puede ser un poco complicado, así que aquí hay una forma de simplificar el análisis. Utiliza la tasa de participación como una aproximación para la distribución, para cada grupo que se desee.
Partiendo del ejemplo anterior, puede ver el porcentaje de beneficios para la fabricación en el mercado medio de Europa y luego analizar el rendimiento de sus representantes en esos acuerdos para determinar la tasa de participación frente a la métrica de la tasa de ganancias.
La tasa de participación es simplemente el número de personas que alcanzan un determinado umbral. No es un concepto nuevo (los líderes comúnmente lo usan para su métrica de cumplimiento de cuota de ventas), pero es absolutamente nuevo para la mayoría de los líderes aplicarlo a otras métricas clave, que incluyen:
- Ratio de ventas finalizadas
- Generación de tuberías de venta
- Conversión de ventas en tubería
- Tiempo hasta la primera venta
- El precio de venta promedio
- Velocidad de negociación
- Volumen de clientes potenciales
- Tasa de conversión
- Reservas
Al evaluar el cumplimiento de la generación de cuota, los umbrales suelen ser del 100% y del 70%. Estos umbrales se basan en la noción de que un equipo con buen desempeño exhibe una “distribución normal” centrada en el objetivo. Un código trampa para una distribución normal que los líderes usan comúnmente es «50 sobre 100 y 70 sobre 70», donde el 50% de su gente alcanza el 100% de la métrica y el 70% alcanza el 70% de la métrica. Este mismo código se puede utilizar para sus otras métricas. Una distribución normal para cualquier métrica dada se verá así:
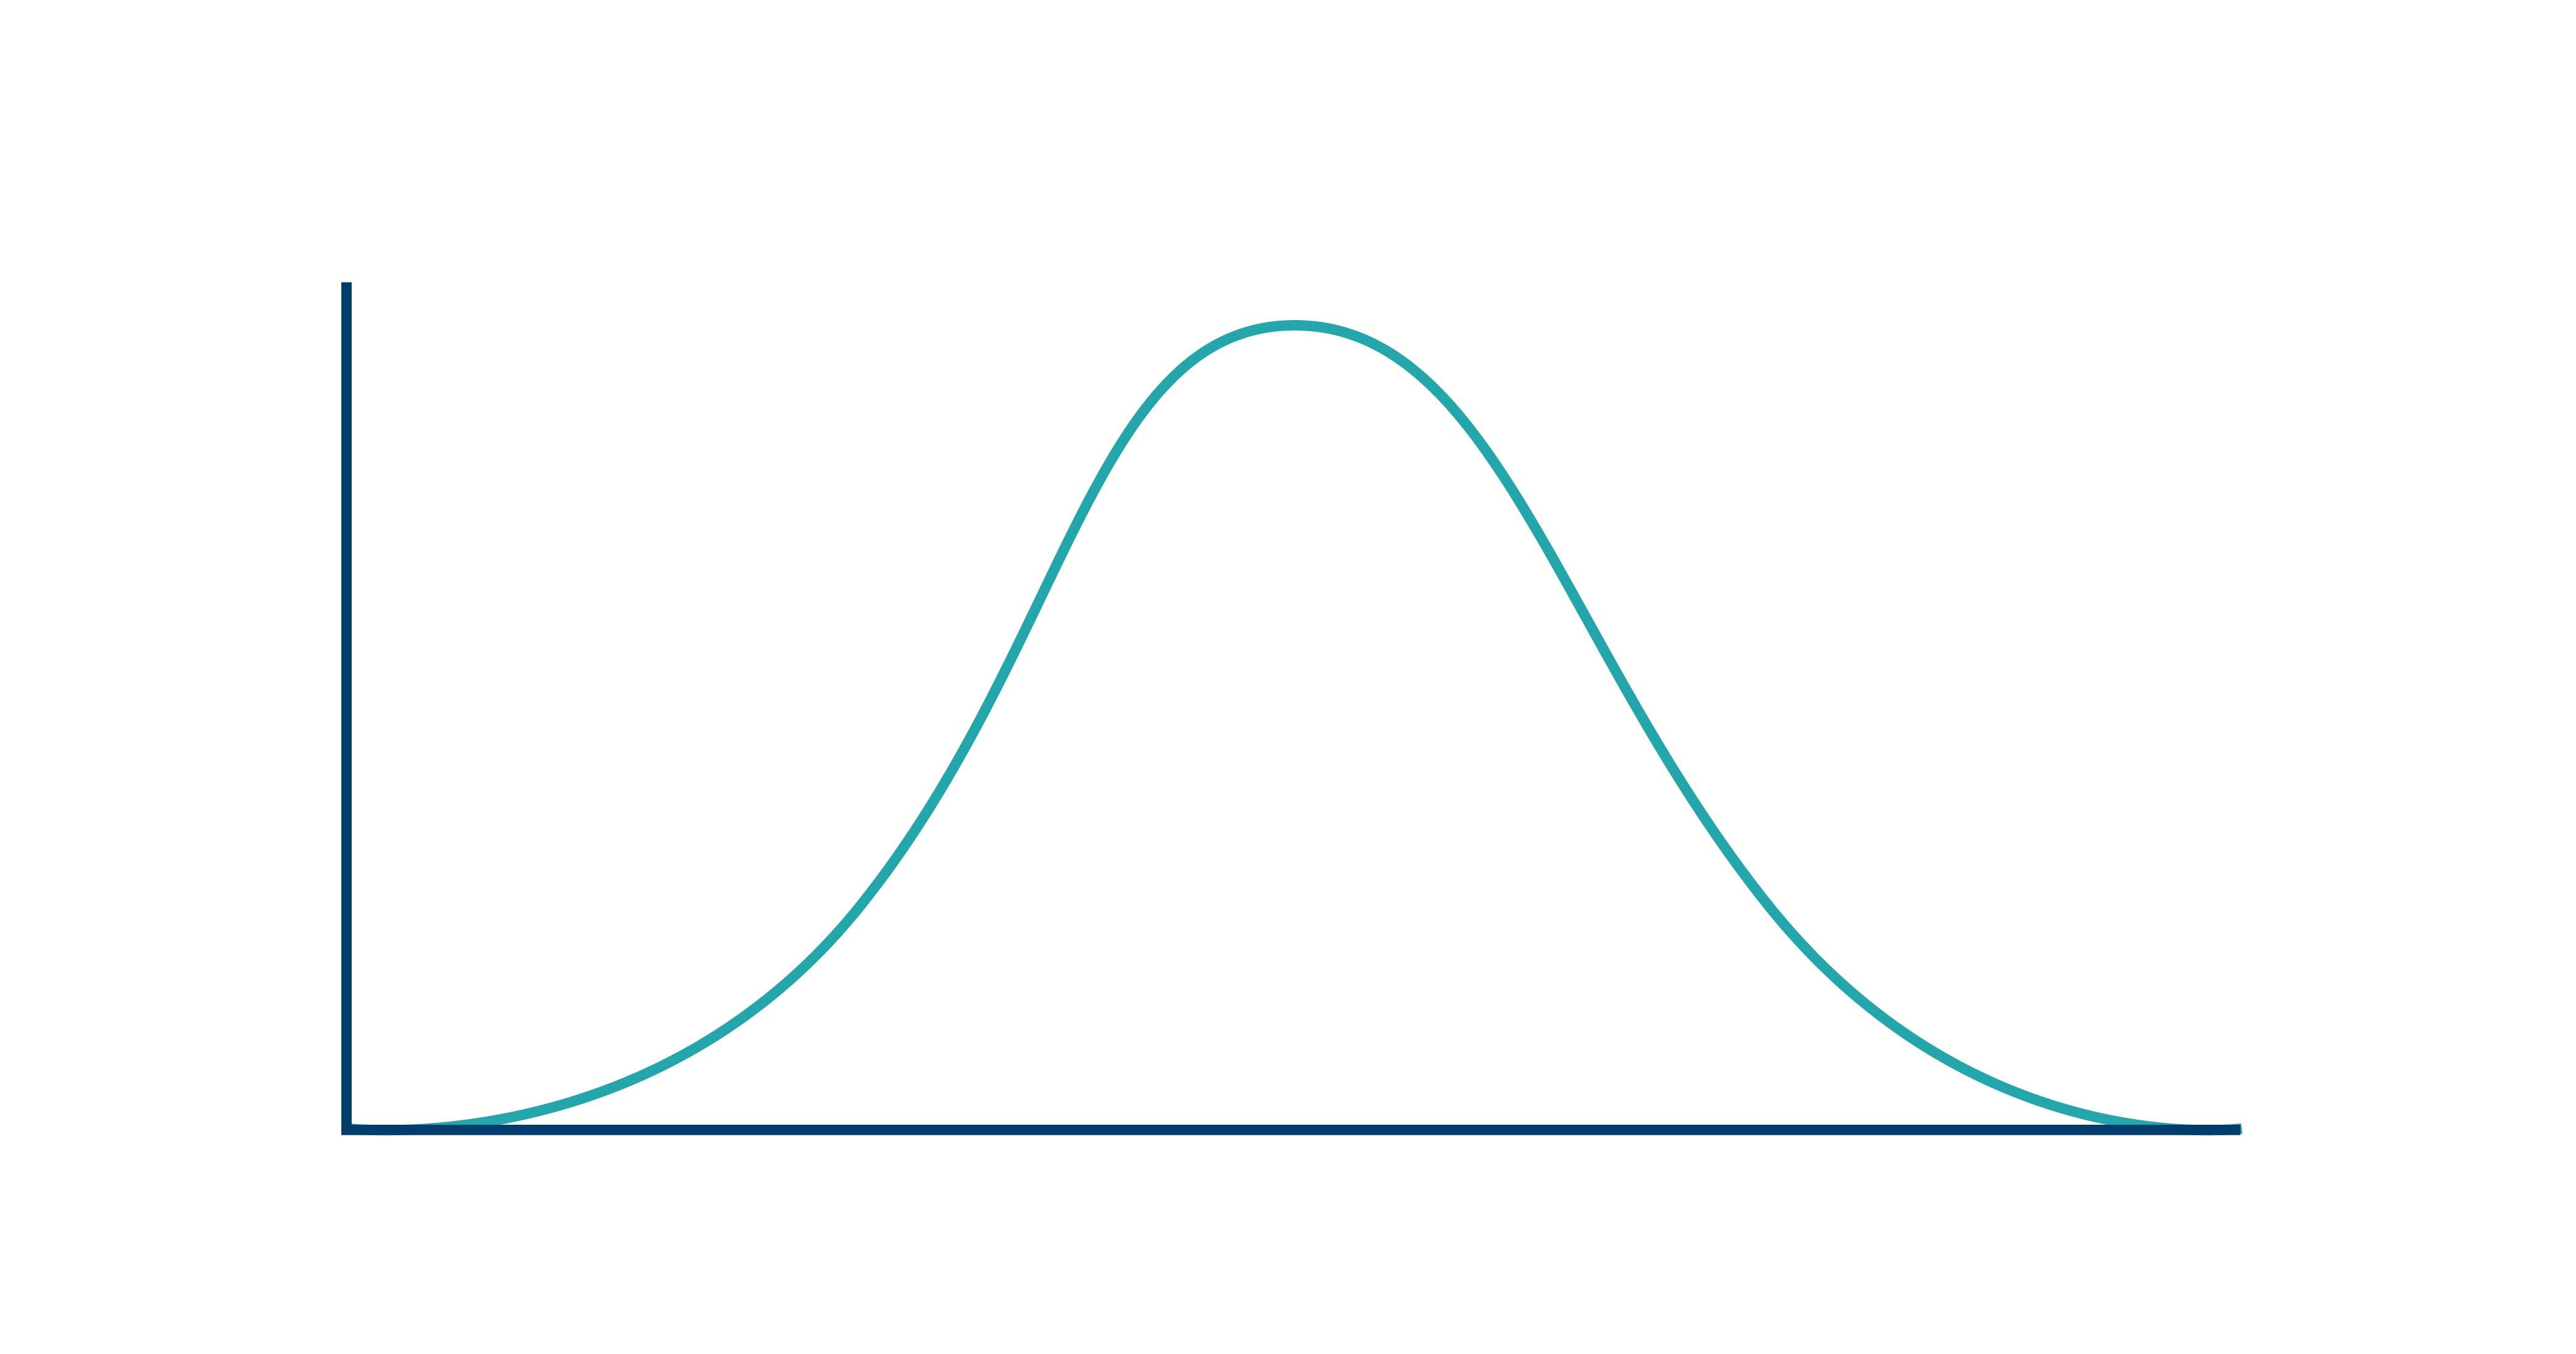
Una distribución normal para cualquier métrica determinada se verá así.
Las distribuciones centradas en las personas cambiarán la forma de pensar sobre el mundo. Pueden revelar problemas y oportunidades:
- Si nadie alcanza la tasa de participación, es probable que haya un problema estratégico grave.
- Si la tasa de participación es bimodal, donde algunas personas tienen un alto desempeño y otras tienen un bajo desempeño, entonces hay un problema de habilitación clásico en el que existe la oportunidad de permitir que los de bajo desempeño se conviertan en los de alto desempeño.
Determinar la tasa de participación a través de métricas brinda una hoja de ruta de qué acciones tomar para mejorar el desempeño de la gente, lo que a su vez aumenta el desempeño del negocio.
El análisis del rendimiento del equipo es rep-centric
Medir el desempeño del equipo de ventas (a diferencia del desempeño de la propia venta) puede marcar una gran diferencia para los equipos de ingresos. Si bien las métricas de desempeño de la venta pueden incluir métricas de resultados como volumen de clientes potenciales, conversión, reservas y métricas de actividad como llamadas, correos electrónicos y cuentas tocadas, el desempeño del equipo de ventas se centra en esas métricas del embudo de ventas en relación con la distribución entre los representantes.
Entonces, mientras que los análisis tradicionales del rendimiento del equipo de ventas se centran en el embudo, los análisis del rendimiento de la venta se centran en los representantes (rep-centric9. Este enfoque ayuda a comprender mejor la causa raíz del rendimiento subóptimo.
Comprender esta distinción y utilizarla para realizar cambios en el equipo a largo plazo ayuda a crear un equipo de ventas ágil y resistente que pueda llevar a la empresa a superar los momentos y desafíos críticos. Como lo expresaron los analistas de McKinsey, si bien las ventas son un negocio de personas (y siempre lo serán), amplificar el poder de las personas con datos y análisis es fundamental para lograr un impacto en el crecimiento.
Como líder, se debe ayudar a las personas a alcanzar su máximo potencial invirtiendo en ellas. Pero para hacerlo, es necesario saber dónde enfocar realmente esos esfuerzos, y si se está volando a ciegas se está mirando un montón de datos sobre sandías. Como líderes, se tiene la responsabilidad de profundizar en las métricas de ventas y continuar con la práctica a medida que la organización crece y escala. Al hacerlo, no solo se encuentran sandías existentes, sino que también se podrán evitar que las sandías futuras se conviertan en problemas más importantes.
No existe el representante de ventas «medio», solo individuos con diferentes niveles de desempeño. Y cuando las deficiencias y los aspectos destacados son evidentes, se pueden tomar medidas más concertadas para preparar a la gente para el éxito y la mejora.
Las personas son el activo más importante, así que es clave eliminar las métricas sandía y priorizar los datos centrados en las personas para impulsar verdaderamente un crecimiento saludable.
